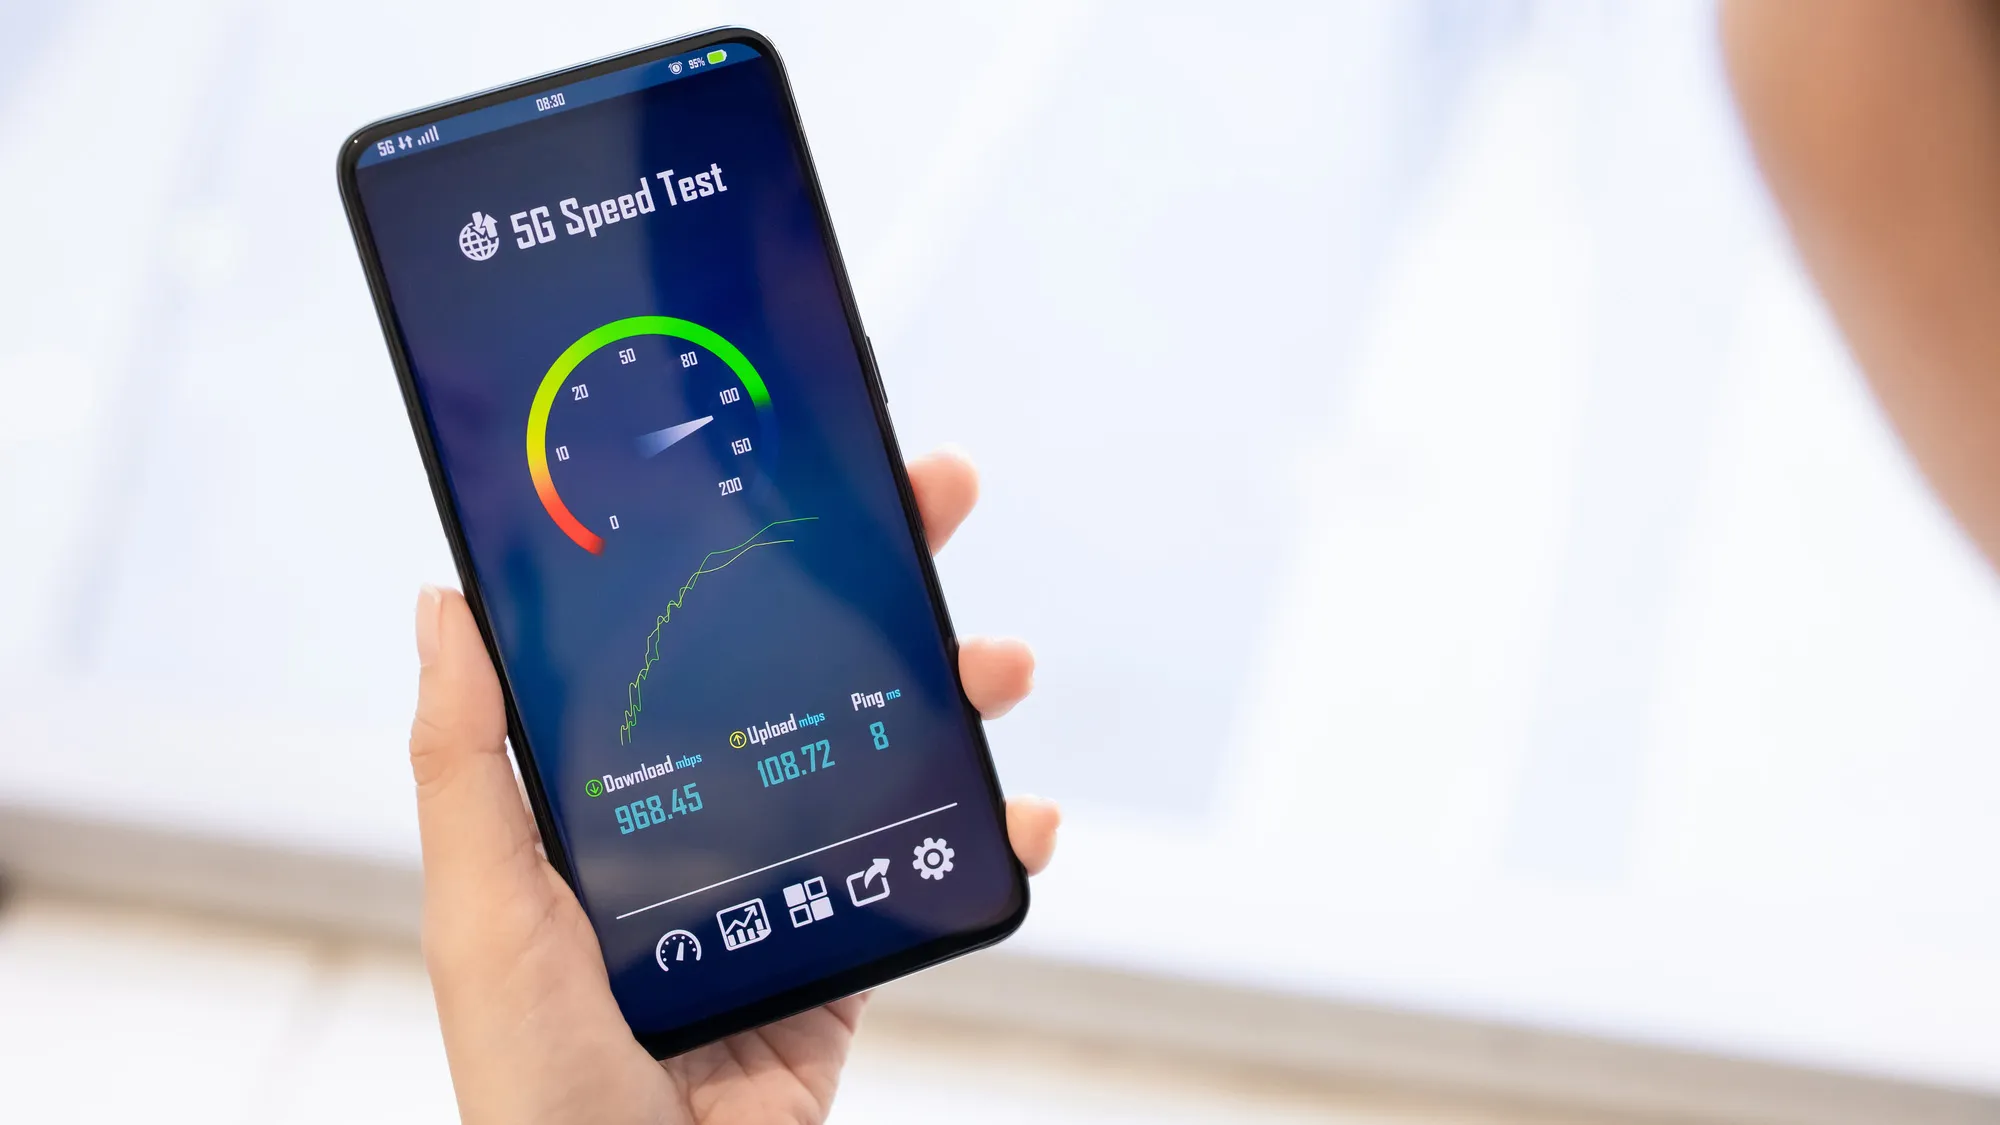
Internet Speed Test
Free, real internet speed test for 164 countries download, upload, ping & jitter, instantly.
Multi opens several parallel connections (closer to real-world browsing/streaming). Single uses one connection (shows the ceiling of a single stream/download).
Press GO to start your free speed test.
Your Network Details
Approximate location based on your public IP address not your precise GPS position.
Your Test History
| Time | Download (Mbps) | Upload (Mbps) | Ping (ms) | Jitter (ms) |
|---|
What Is an Internet Speed Test and Why It Matters
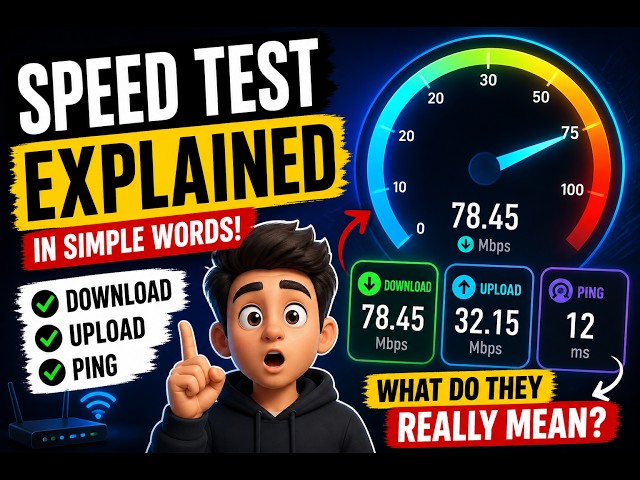
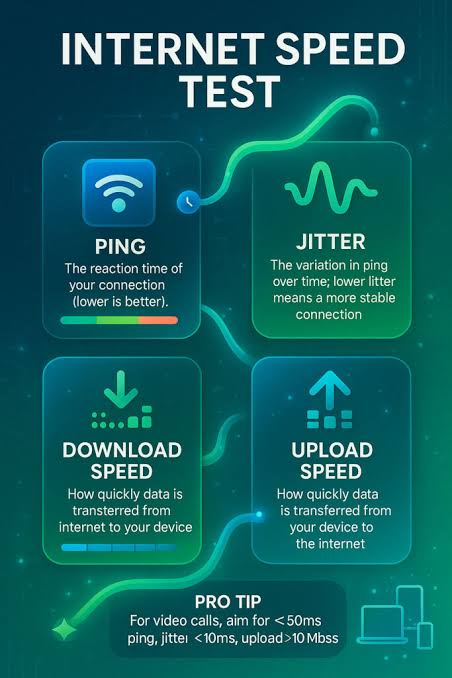
An internet speed test measures how fast data moves between your device and the wider internet, expressed through four core numbers: download speed, upload speed, ping, and jitter.
Download speed, measured in megabits per second, tells you how quickly your connection pulls data from a server, which governs how fast a Netflix episode buffers or a Steam game downloads.
Upload speed measures the reverse, critical for video calls on Zoom, uploading footage to YouTube, or backing up files to Google Drive.
Ping, measured in milliseconds, is the round-trip latency to a server, the number that decides whether a shot lands in Valorant or a call on Microsoft Teams lags. Jitter measures how much that latency fluctuates, which matters enormously for VoIP calls and live streaming stability.
\n\nThe idea of testing connection speed goes back to the dial-up and early broadband era, when tools like Ookla's Speedtest, launched in 2006, gave consumers their first simple way to check what they were actually getting from providers like AOL, Comcast, or BT.
As broadband replaced dial-up and fiber replaced DSL from providers such as AT&T, Verizon Fios, and Jio Fiber in India, the stakes of an accurate reading grew: gigabit plans, cloud gaming, and 4K streaming all demand real measurement, not guesswork.
Today, with hybrid work, telehealth, and online education depending on stable connections, a speed test has shifted from a curiosity for tech enthusiasts into a basic diagnostic tool that ordinary households and businesses reach for whenever something feels off.
- Verify your ISP planIf you pay Comcast Xfinity for a 500 Mbps plan or BSNL Bharat Fiber for 100 Mbps, a speed test confirms whether you actually receive that throughput or whether congestion, throttling, or an outdated modem is cutting it short.
- Diagnose slow connectionsRunning a test at different times of day reveals whether slowdowns come from peak-hour congestion on your local Vodafone or Telstra network, in-home Wi-Fi interference, or a genuine last-mile fault worth reporting.
- Compare providers before switchingSomeone choosing between Deutsche Telekom DSL, Vodafone cable, and a new fiber entrant like Deutsche Glasfaser can use repeated test results to see which actually delivers stable speeds in their specific street or building, not just in marketing brochures.
- Check readiness for specific tasksStreaming 4K on Netflix needs roughly 15-25 Mbps, competitive gaming cares far more about ping and jitter than raw throughput, and remote work over Zoom or Microsoft Teams depends on consistent upload speed, so the right metric depends on the use case.
- Troubleshoot Wi-Fi versus wired performanceTesting on Ethernet versus over 2.4GHz or 5GHz Wi-Fi from a TP-Link or Netgear router isolates whether the bottleneck is your ISP connection or your home network hardware and placement.
- Support pre-purchase researchRenters and buyers checking whether a new address in Lagos, Manila, or Warsaw can get reliable fiber from providers like MTN, PLDT, or Orange often rely on neighborhood speed test data before signing a lease.
- Hold providers accountable with evidenceA logged history of test results with timestamps gives customers concrete proof to bring to Airtel, Telkom, or Claro customer support instead of a vague complaint about "slow internet."
A speed test is only as useful as its accuracy. A result that is rounded, cached, or run against a single distant server tells you little about what your connection can actually do right now, on your network, for the task in front of you.
That is why a real-time, in-browser measurement, run without installing an app, using multiple close-by servers and reporting download, upload, ping, and jitter together, matters more than a single headline number.
Internet Speed Test runs that test in 164 countries, from broadband in Seoul to satellite links in rural Alaska, giving anyone, anywhere, a fast, honest read on their connection in under a minute.
How This Free Speed Test Tool Works
Every result on this page comes from live measurements taken between your device and nearby test infrastructure, not from an estimate or a cached average.
Ping is measured first by sending a series of small round-trip requests, timing how long each one takes in milliseconds, and averaging the results while discarding outliers caused by background traffic.
Jitter is calculated from the variation between those individual ping samples, which is why a connection can show a low average ping but still feel unstable during a video call on Zoom or a competitive match on Valorant if jitter is high.
This mirrors the same round-trip-time logic used by tools like Ookla Speedtest and Cloudflare's speed test, adapted here to run entirely in the browser with no plugin required.
\n\nOnce latency is established, the tool measures download speed by streaming multiple data chunks simultaneously from the test server to your browser, then measuring how many megabits arrive per second as the transfer ramps up.
Upload works in reverse, pushing generated data from your device outward, which is often the more revealing number for anyone using cloud backup services like Google Photos, uploading footage to YouTube, or working over a VPN back to a corporate network.
Because real networks from providers like Reliance Jio in India, Vodafone in Germany, or Spectrum in the United States rarely saturate on a single connection, especially over cable or shared fiber, the test is built to reflect how those networks actually behave under everyday load rather than under a single idealized stream.
Step by Step
- Location and ISP detectionThe tool reads your IP address to identify your country, city, and internet service provider, then selects the nearest available test server to keep results geographically fair.
- Ping and jitter probesA burst of small requests fires between your browser and the server, recording round-trip time in milliseconds and calculating jitter from the variance across samples.
- Connection mode selectionThe test applies your chosen Multi or Single connection mode, opening either several parallel streams to reflect real-world usage or one stream to reveal per-connection throughput caps.
- Download phaseData streams from the server to your device for several seconds while the animated gauge updates in real time as throughput ramps up, peaks, and stabilizes.
- Upload phaseThe direction reverses, sending generated data from your browser to the server to measure how quickly you can push data outward, which matters for calls, backups, and streaming.
- Results compiled instantlyPing, jitter, download, and upload figures are combined into a final report displayed immediately in the browser, with nothing installed, stored, or sent through a signup form.
Key Points
- Multiple parallel streamsDownload and upload use several parallel TCP connections at once, similar to how Ookla Speedtest and Fast.com operate, so a single slow-starting stream does not understate a 500 Mbps fiber line from Proximus in Belgium or NTT in Japan.
- TTFB versus jitterPing reports the round-trip time of a single lightweight request, while jitter measures how much that time varies across dozens of samples, which matters more for VoIP calls and Zoom on a Vodafone Idea connection in Mumbai than for simple browsing.
- Geo-matched test serversRequests route to a nearby measurement endpoint chosen by your detected location, so a user on Telkom in Johannesburg is not accidentally measured against a server in Frankfurt, which would inflate latency and understate throughput.
- ISP and connection fingerprintingAlongside speed, the tool reads your public IP to identify the network operator, whether that is Comcast Xfinity in Chicago, Jio in Delhi, or Claro in Sao Paulo, and flags whether you are on Wi-Fi, Ethernet, or a mobile 4G/5G radio.
- Overhead-adjusted throughputRaw TCP payload numbers are adjusted for protocol overhead from TLS handshakes and HTTP headers so the displayed Mbps reflects usable throughput, not the inflated line-rate figure some routers report.
- No caching artifactsTest payloads are generated randomly and marked non-cacheable, preventing ISP transparent proxies or browser caches, common on some mobile networks in Indonesia and the Philippines, from returning a falsely fast result.
A speed test is only as trustworthy as the method behind it, and that method has to survive contact with real-world networks, from a Starlink dish in rural Montana to a Jazz 4G connection in Lahore to Deutsche Telekom fiber in Berlin.
By combining short low-payload probes for ping and jitter, multi-connection streaming for realistic download and upload throughput, live animated feedback, and automatic ISP and location detection, this tool gives a result in under 30 seconds that closely mirrors what your devices actually experience day to day.
There is nothing to install, nothing to register, and nothing left behind after you close the tab, which is exactly why it works equally well whether you are checking a home broadband upgrade from Vodafone in the UK or troubleshooting a flaky office connection on Airtel in Bangalore.
Understanding Mbps, Download Speed and Upload Speed
Mbps stands for megabits per second, the standard unit ISPs use to advertise plan speeds worldwide, from Jio and Airtel in India to Deutsche Telekom in Germany and Comcast Xfinity in the United States.
It measures how many millions of bits move through your connection each second. File sizes, however, are usually shown in megabytes (MB), and one byte equals eight bits, so converting between them means dividing by eight, not by ten.
A 100 Mbps connection therefore downloads at a theoretical maximum of about 12. 5 MB/s, and a 2 GB game update at that speed takes roughly two and a half minutes under ideal conditions, before accounting for server-side limits or Wi-Fi overhead.
Download and upload speeds are rarely equal, and that asymmetry is intentional in most consumer plans.
Cable technologies like DOCSIS, used by Comcast in the US and Virgin Media in the UK, and older ADSL lines still common in parts of Latin America and Southeast Asia, allocate far more bandwidth to downstream traffic because most home use, streaming Netflix, browsing, downloading files, is download-heavy.
Fiber-to-the-home services from providers like NBN in Australia, Jio Fiber in India, or Google Fiber in the US increasingly offer symmetrical plans, which matter more now that video calls on Zoom, cloud backups to Google Drive or iCloud, and live streaming on Twitch depend equally on upload capacity.
When Internet Speed Test shows a large gap between the two, that is often the technology itself, not a fault.
- Web browsing and email1 to 5 Mbps is enough for loading text-heavy sites and checking Gmail or Outlook, but pages with heavy JavaScript, ads, and high-resolution images on sites like news portals or e-commerce stores load noticeably faster above 10 Mbps.
- HD video streamingNetflix, Disney+, and Amazon Prime Video recommend 5 Mbps for 1080p streams, while YouTube in HD can adapt down to 3 Mbps with reduced buffering. Add 5 Mbps per simultaneous stream if multiple people in the household are watching at once.
- 4K and HDR streamingNetflix and Apple TV recommend at least 25 Mbps for a stable 4K Ultra HD stream, and services with HDR or Dolby Vision, common on newer LG and Samsung televisions, can push real-world usage closer to 35 to 40 Mbps during peak bitrate scenes.
- Video calls and conferencingZoom and Microsoft Teams need roughly 3 to 4 Mbps of upload and download for one-to-one HD video, but group calls with gallery view on Google Meet or Teams can require 8 Mbps or more in both directions to avoid frozen frames.
- Online gamingCompetitive titles like Valorant, Counter-Strike 2, and Call of Duty run fine on as little as 3 to 6 Mbps because they prioritize low ping and jitter over raw throughput, but console platforms like PlayStation Network and Xbox Live recommend 10 to 25 Mbps to keep game downloads, patches, and cloud saves from choking your connection during play.
The most useful way to read a Internet Speed Test result is side by side with your ISP contract.
If Vodafone Germany, Airtel India, Telkom Indonesia, or Spectrum in the United States advertises "up to 100 Mbps," regulators in most countries, including Ofcom in the United Kingdom and the FCC in the United States, consider 80 percent of that figure during peak evening hours an acceptable real-world outcome.
So a result of 78 to 100 Mbps on fiber or cable is normal, while a repeated result under 50 Mbps on the same plan, especially with high jitter, points to network congestion, a weak Wi-Fi signal, or a fault worth raising with your provider.
Run the test on a wired connection first to isolate the ISP's performance from your home Wi-Fi, then repeat it over Wi-Fi to see the gap; a large difference usually means the router, not the internet plan, is the bottleneck.
Understanding Ping, Latency and Jitter
Ping, often called latency, measures the round-trip time in milliseconds for a small data packet to travel from your device to a server and back. It is the delay you feel, not the bandwidth you have.
When you click to shoot in Fortnite, ask a question on a Microsoft Teams call, or place a trade through an online brokerage, ping determines how quickly that action registers on the other end.
Three factors drive ping upward: physical distance, since light in fiber optic cable takes roughly 5 milliseconds to travel 1,000 kilometers even under ideal conditions, so a user in Lagos testing against a server in Sao Paulo will always see higher baseline latency than one testing against a local Lagos node; network congestion, where shared infrastructure from providers like Comcast Xfinity or Jio during peak evening hours creates queuing delays at routers; and inefficient routing, where traffic from a South Korean ISP like KT Corporation might hop through Tokyo, Los Angeles, and Frankfurt before reaching a server in Berlin instead of taking a more direct path.
Jitter is the variation in ping from one packet to the next, expressed in milliseconds. A connection with a steady 40ms ping every time is more usable than one that swings between 15ms and 90ms, even though the average might look similar.
This matters enormously for real-time applications because voice and video codecs used by WhatsApp, Discord, and Zoom rely on a predictable stream of packets arriving at regular intervals to reconstruct audio and video smoothly.
High jitter causes choppy audio, frozen video frames, and desynced lips even when download speed is more than adequate.
Gaming and VoIP consistently suffer more from unstable, high-latency connections than from insufficient bandwidth, which is why a rural satellite user on Starlink with 300 Mbps download but variable ping often has a worse Zoom experience than an office worker on a modest 50 Mbps DSL line in Lyon with rock-solid 20ms latency.
- Under 20ms ExcellentTypical of fiber connections within the same metro area, such as Google Fiber in Kansas City or Deutsche Telekom fiber in Frankfurt. Competitive gamers on titles like Valorant or CS2 get near-instant hit registration at this range.
- 20-50ms Very GoodCommon on cable and fiber connections to a regional server, for example a Vodafone UK user testing to a London node or a Telstra customer in Sydney hitting a Melbourne server. Video calls on Zoom or Google Meet feel natural with no perceptible lag.
- 50-100ms GoodNormal for connections crossing a country or reaching a neighboring one, such as a user in Warsaw connecting to a server in Amsterdam. Cloud gaming on services like GeForce NOW starts to feel slightly soft, and fast-paced shooters show minor input delay.
- 100-150ms FairTypical of intercontinental routes, like a South African user on Vodacom reaching a US East Coast server, or a Southeast Asian user in Manila on PLDT testing to Singapore. Voice calls develop a faint but noticeable conversational lag.
- 150-300ms PoorSeen on long-haul international routes or congested satellite links, such as Starlink users in remote areas of Alaska or rural Australia during peak hours. Turn-based games remain fine, but real-time multiplayer becomes frustrating and calls suffer audible overlap.
- 300ms and above Very PoorCharacteristic of geostationary satellite internet like older HughesNet plans, or mobile connections on congested 3G networks in parts of sub-Saharan Africa. Video calls stutter, screen sharing lags badly, and online gaming becomes effectively unplayable.
A 500 Mbps fiber connection with 180ms ping and 40ms jitter will lose a competitive match against a 100 Mbps connection running 15ms ping and 2ms jitter, because real-time applications care about response timing, not raw throughput.
When you run a test on Internet Speed Test, look past the big download number and check the ping and jitter figures alongside it.
If ping sits under 30ms and jitter stays below 5ms, whatever plan you have is genuinely capable of high-end gaming and glitch-free video calls, regardless of what the megabit figure says.
Global Internet Speed Benchmarks: How Countries Compare
Internet speeds are not evenly distributed across the planet, and the gaps are large enough to change how people work, stream, and game.
Singapore consistently tops global fixed broadband rankings with average download speeds well above 300 Mbps, driven by near-universal fibre-to-the-home coverage from providers like StarHub and Singtel.
South Korea, home to SK Broadband and KT, built one of the earliest gigabit fibre networks in the world and pairs it with a mature 5G mobile rollout that regularly delivers mobile download speeds above 200 Mbps in Seoul and Busan.
The UAE and Qatar, through Etisalat, du, and Ooredoo, rank among the fastest mobile markets globally because both countries built dense 5G infrastructure into compact, wealthy urban populations, an approach that keeps latency low and throughput high even at peak hours.
Regional patterns matter as much as individual leaders. The Nordic and Baltic states, including Sweden, Denmark, Norway, Estonia, and Lithuania, combine strong fixed fibre penetration with efficient regulatory environments, giving them some of the most consistent average speeds in Europe.
Elsewhere the picture is more mixed. Western Europe generally outpaces Southern and Eastern Europe, though Romania is a notable exception with fibre speeds that rival Western capitals.
East Asia leads Southeast Asia, where Vietnam and Malaysia are climbing quickly while the Philippines and Indonesia still show wide rural-urban gaps. North America splits sharply between the United States and Canada's strong urban fibre and cable networks and their comparatively weaker rural coverage.
South America is led by Chile and Uruguay, both ahead of Brazil and Argentina on fixed broadband. Africa shows enormous variance, with South Africa, Kenya, and Rwanda advancing quickly on mobile broadband via Safaricom and MTN, while others lag due to limited backbone infrastructure.
Australia and New Zealand in Oceania post solid but not top-tier numbers, held back by geography and the slower-than-planned rollout of the National Broadband Network.
- Fiber and full-fibre penetrationSingapore, South Korea, and Spain have pushed fibre-to-the-home coverage above 90 percent of households, while much of the United States and Canada still relies on cable and DSL in suburban and rural areas, capping realistic upload speeds.
- Spectrum policy and 5G rollout densitySouth Korea, China, and the UAE cleared mid-band and mmWave spectrum early and allowed dense small-cell deployment in cities like Seoul, Shanghai, and Dubai, while spectrum auctions in Brazil, India, and Nigeria lagged by several years, delaying mobile speed gains.
- Population density and last-mile economicsSmall, dense markets like Hong Kong, Monaco, and Malta let operators justify fibre to nearly every building, whereas sparsely populated countries like Canada, Australia, and Kazakhstan face high per-household costs that slow rural upgrades and widen the urban-rural gap.
- Market competition and regulatory investment incentivesCountries with multiple aggressive ISPs competing on speed, such as France with Orange, Free, and SFR, or Romania with RCS and RDS, tend to out-pace markets with a single dominant incumbent and weak regulatory pressure to upgrade infrastructure.

The gap between the fastest and slowest countries on Internet Speed Test is not random, it tracks decades of infrastructure decisions, spectrum policy, and market competition.
A user in Singapore testing on StarHub fibre and a user in rural Mozambique on a 3G fallback are both measuring real, honest numbers, but they sit at opposite ends of a curve shaped by geography and investment, not by chance.
Running the test regularly, especially while switching between Wi-Fi and mobile data, is the clearest way to see exactly where your own connection sits on that global curve, and whether your ISP is actually delivering the plan you pay for.
Broadband Technology Explained: Fiber, Cable, DSL, Satellite and Fixed Wireless
The technology carrying your internet connection into your home shapes every result you see on a speed test far more than your subscribed plan tier does.
Fiber to the home, or FTTH, uses pulses of light through glass strands and is the gold standard: providers such as Google Fiber and Ziply Fiber in the United States, Jio and Airtel in India, China Telecom across urban China, and Init7 in Switzerland routinely deliver symmetrical speeds of 1 Gbps or higher with latency under 5 milliseconds.
DOCSIS-based cable, run by operators like Comcast Xfinity, Charter Spectrum, Virgin Media O2, and Rogers in Canada, reuses coaxial copper originally built for television and reaches 500 Mbps to 1. 2 Gbps downstream under DOCSIS 3.
1, but upload speeds lag well behind until DOCSIS 4. 0 deployments mature.
Older copper telephone lines carrying ADSL2+ or VDSL2, still common from Telkom South Africa to rural stretches of France Telecom's Orange network and BT Openreach in the UK, top out around 20-100 Mbps and degrade quickly with distance from the exchange or street cabinet.
Where wired infrastructure is impractical, fixed wireless and satellite fill the gap.
Fixed wireless access, delivered over 4G LTE or 5G from carriers like T-Mobile, Verizon, Vodafone, and MTN across Nigeria and Ghana, beams a signal to a rooftop or window-mounted receiver and can deliver 50-300 Mbps with latency around 20-40ms, making it a genuine cable alternative in suburban and semi-rural markets.
Satellite internet splits into two eras: legacy geostationary services like HughesNet and Viasat orbit 35,786km up, producing high latency near 600-800ms that makes video calls and gaming difficult, while low Earth orbit constellations such as Starlink, OneWeb, and the emerging Amazon Kuiper orbit around 500-1,200km, cutting latency to 25-60ms and pushing speeds past 100-200 Mbps in many regions, including remote parts of Mongolia, the Amazon basin, and the Scottish Highlands where no other option exists.
- DOCSIS 3.1 upload asymmetryMost cable networks in the US, Canada, and the UK still ship far more download than upload capacity, so a 500 Mbps Virgin Media or Xfinity plan may cap uploads near 20-35 Mbps until DOCSIS 4.0 rolls out.
- Fiber's latency advantageFTTH connections from providers like Free in France, Jio AirFiber in India, or Chorus in New Zealand routinely post 2-5ms local ping times, making them the only reliable choice for competitive gaming and real-time video production.
- Copper's distance penaltyVDSL2 speeds on lines from BT Openreach or Deutsche Telekom fall off sharply beyond 500-800 meters from the cabinet, meaning two houses on the same street can see a 3x speed difference.
- LEO satellite latency has collapsedStarlink now averages 25-45ms in most regions versus 600ms+ on legacy geostationary services like HughesNet or Viasat, because its satellites orbit at roughly 550km instead of 35,786km.
- Fixed wireless as a cable/fiber substituteT-Mobile Home Internet and Verizon 5G Home in the US, and similar LTE/5G CPE offerings from Vodafone in parts of Africa and Eastern Europe, now rival cable speeds in areas where trenching fiber is uneconomical.
- Weather and obstruction sensitivitySatellite and millimeter-wave fixed wireless links can lose 20-50% of throughput during heavy rain or snow, a factor cable and fiber connections are essentially immune to.
No single technology wins everywhere, which is exactly why Internet Speed Test tests real download, upload, ping, and jitter rather than relying on advertised specs: a Starlink user in rural Chile, a Jio Fiber subscriber in Mumbai, and a Virgin Media customer in Manchester will all see meaningfully different numbers even at the same nominal plan price.
Understanding whether your connection runs over glass, coax, copper, radio, or satellite explains not just your top speed but the jitter and latency that determine whether video calls stutter or games lag, and running a test on the actual technology serving your address is the only way to know what you're really getting.
Mobile Internet: 4G, 5G and How Mobile Speed Test Results Differ Worldwide
Mobile networks have moved through distinct generations, each with its own speed and latency profile. 3G networks, still relied on in parts of rural Africa and Southeast Asia, typically deliver 1 to 5 Mbps with latency above 100ms.
4G LTE, the backbone of mobile data in most of the world including large parts of India, Brazil, and Indonesia, generally delivers 15 to 50 Mbps with latency around 30 to 50ms, and LTE-Advanced deployments from carriers like T-Mobile in the United States or EE in the United Kingdom push that higher still.
5G changes both numbers substantially, but not uniformly, because 5G is really two different technologies wearing one name.
Sub-6GHz 5G, the version deployed widely by carriers such as Verizon, China Mobile, and SK Telecom, typically delivers 100 to 400 Mbps with latency near 20ms, and it covers wide areas much like 4G does.
mmWave 5G, used selectively by Verizon in US stadiums and dense city blocks, or by KT in parts of Seoul, can exceed 1 Gbps and push latency below 10ms, but its range is measured in hundreds of meters and it struggles to penetrate walls or glass.
This is why a speed test result on a phone means something different in Seoul, where mmWave and sub-6GHz 5G blanket dense urban cores, than in a 4G-dominant market like Nigeria or the Philippines, where LTE remains the everyday experience despite growing 5G rollout in major cities.
- Network band and spectrumA phone on Verizon or AT&T mmWave 5G near a stadium can hit 1.5 Gbps, while ten meters away, outside the beam's line of sight, the same carrier drops to LTE speeds; sub-6GHz 5G from carriers like Vodafone or Jio behaves far more consistently across distance.
- Carrier and spectrum allocationTwo phones on different carriers in Manila or Lagos can show a 5x gap because one operator, such as Globe Telecom or MTN, has more mid-band spectrum or denser small-cell deployment in that specific neighborhood than its rival.
- Device modem and antennaAn iPhone 12 with a Qualcomm X55 modem and an older Android with a budget MediaTek chipset will report different throughput on identical signal, because modem generation, antenna count, and thermal throttling all cap real-world speed independently of the network.
- Tower congestion and time of dayA test run at 8pm in a dense area of Seoul or Mumbai, when thousands of nearby devices share the same cell, will read slower than the same spot at 6am, even though signal bars look identical.
- Indoor vs outdoor positionConcrete, low-E glass, and elevator shafts attenuate 5G mmWave and even sub-6GHz signals sharply; a phone by a window can outperform one three meters deeper inside the same room by a wide margin.
- Network slicing and plan throttlingSome prepaid or capped plans, common with carriers like Jio in India or Claro in Brazil, deprioritize a user's traffic after a data threshold, so two phones on the same tower but different plans see very different measured speeds.
- Roaming and VPN overheadA visiting traveler roaming onto a local network, or a phone routing traffic through a VPN, adds latency and caps throughput well below what a local SIM on the same tower would measure.
The practical takeaway is that a single mobile speed test result is a snapshot of many overlapping variables, not a fixed property of a phone or a country.
Someone testing on Rakuten Mobile in Tokyo, EE in London, or Telstra in Sydney should expect real variation between morning and evening, indoors and outdoors, and even between two phones standing side by side.
Running the test a few times, in different locations and at different hours, and checking the detected ISP and connection type shown alongside the result gives a far more honest picture of actual mobile performance than any single reading.
Speed Requirements by Use Case: Streaming, Gaming, Video Calls, Remote Work and Smart Homes
The right internet speed is not a single number, it depends entirely on what you are doing and how many devices are competing for bandwidth at the same time.
A household in Lagos running one 4K stream on DStv's streaming app has very different needs from a remote software developer in Krakow tunneling into a corporate VPN over Orange Polska fiber while syncing a 40GB codebase to Git and joining a Google Meet call.
Providers advertise headline download speeds, but the metrics that actually determine whether your experience feels smooth are download throughput, upload throughput, ping (latency) and jitter, and each use case weighs these differently.
Streaming and file downloads are mostly about raw download Mbps. Gaming and video calls are mostly about latency and jitter, since a 500 Mbps connection with 120ms ping to a game server in Tokyo will still feel sluggish in Valorant or Fortnite.
Remote work and smart homes are about sustained capacity across many simultaneous, lower-intensity connections.
Use the benchmarks below as a floor, not a target, since real-world throughput on providers like Vodafone in Germany, Airtel in India, or Claro in Brazil often falls 20 to 30 percent below advertised speeds during peak hours, particularly on shared cable or fixed-wireless networks.
- SD and HD streamingNetflix and Disney+ need 3 Mbps for SD and 5 Mbps for HD; add 3 Mbps per simultaneous stream if multiple people in the household are watching on Sky Q, Foxtel or a Fire TV Stick at once.
- 4K and 8K streaming4K on Netflix, YouTube or Prime Video needs 25 Mbps sustained, and early 8K content on YouTube can spike past 50 Mbps; buffering usually means your connection dips below this floor, not that your average speed is too low.
- Competitive online gamingTitles like Valorant, CS2 and Call of Duty: Warzone need only 3 to 6 Mbps download and 1 to 3 Mbps upload, but ping under 30ms and jitter under 10ms matter far more than raw speed, especially on servers in Frankfurt, Singapore or Sao Paulo.
- Cloud gamingXbox Cloud Gaming, GeForce Now and PlayStation Plus Premium recommend 15 to 20 Mbps and ping under 40ms; on fiber providers like Jio AirFiber in India or Virgin Media in the UK this is easy, but on satellite links like rural Starlink it can be inconsistent.
- Video calls and conferencingZoom and Microsoft Teams need 3.8 Mbps down and 3 Mbps up for HD one-to-one calls, rising to 8 Mbps in each direction for group calls with screen share; ping above 150ms causes the audio lag common on cross-continental calls between, say, Manila and Toronto.
- Remote work, VPN and cloud syncA NordLayer or Cisco AnyConnect VPN, plus background OneDrive or Google Drive sync and a Teams call, can realistically consume 15 to 25 Mbps down and 5 to 10 Mbps up at once, so a nominal 10 Mbps line from a DSL provider like BSNL often falls short under real multitasking load.
- Smart home and IoT densityEach Amazon Echo, Ring doorbell or Philips Hue hub uses under 1 Mbps individually, but a household running 20 to 30 devices alongside a TP-Link Deco mesh network should budget 50 to 100 Mbps total to avoid congestion during peak evening hours.
The practical takeaway is that most households underestimate their true bandwidth needs because they add up individual use cases instead of accounting for overlap.
A family of four in Manila streaming 4K on one TV, gaming on a PS5, running a Zoom call for remote work, and managing fifteen smart home devices through a TP-Link or Ubiquiti router needs a combined 100 to 150 Mbps with sub-30ms ping to their ISP's gateway, not the 25 Mbps that covers a single 4K stream in isolation.
Run a real-time test with Internet Speed Test to see your actual download, upload, ping and jitter figures against your ISP, whether that is Comcast Xfinity in the US, BT in the UK, or PLDT in the Philippines, and compare them directly to the thresholds above before assuming a slow video call or laggy game is your router's fault rather than your plan's.
How to Improve Your Internet Speed: A Complete Troubleshooting Guide
Slow internet rarely has one single cause, and chasing the wrong fix wastes hours.
Before assuming your ISP is throttling you or that you need a pricier plan, it helps to separate three categories of problems: your local hardware and Wi-Fi environment, congestion on the shared network during peak hours, and genuine capacity limits from your provider.
A five-year-old router broadcasting only on a congested 2.
4GHz channel will underperform no matter how fast your plan is, while a brand-new mesh system connected over old copper DSL in a rural area outside Cape Town or regional Australia will hit a hard ceiling no configuration can fix.
The most reliable way to diagnose the problem is to measure it.
Run a test on Internet Speed Test over a wired Ethernet connection first, then repeat it over Wi-Fi from the room where you actually work; the gap between those two numbers tells you immediately whether the bottleneck is your wireless setup or something upstream.
If wired speeds already fall short of what you're paying Vodafone, Xfinity, Jio, or Telkom for, the issue sits with the ISP or the line itself, and no router tweak will solve it.
If wired speeds look fine but Wi-Fi lags badly, the fix is almost always local: placement, interference, or outdated equipment.
Step by Step
- Run a baseline test firstUse Internet Speed Test to measure download, upload, ping, and jitter with a wired connection if possible, so you have a clean number to compare against as you troubleshoot.
- Restart the router and modemPower them off for 30 seconds and back on; this clears memory leaks and forces a fresh connection to your ISP's network, fixing a surprising share of slowdowns instantly.
- Check placement and physical obstructionsMove the router to a central, elevated spot away from microwaves, aquariums, and thick walls; even 3-4 meters and one extra wall can cut Wi-Fi throughput by half.
- Update the router firmwareLog into the admin panel and check for updates; manufacturers like TP-Link, Netgear, and ASUS regularly patch performance and security issues that directly affect throughput.
- Scan for channel congestionUse a Wi-Fi analyzer app to see which channels neighboring networks occupy, then manually set your router to a less crowded channel instead of relying on auto-select.
- Identify bandwidth hogs on the networkCheck connected devices for background culprits like cloud backups, auto-updating game clients, or a smart TV streaming in 4K, and pause or schedule them outside your usage window.
- Test at different times of dayRun Internet Speed Test tests during peak hours (7-11pm) and off-peak hours; if speeds only drop in the evening, it points to local network congestion on your ISP's shared infrastructure, not your home setup.
- Call your ISP with evidence, then decide fix vs upgradeBring wired test results, timestamps, and screenshots; if the wired speed matches your plan, the issue is local and fixable, but if it consistently falls short, request a technician visit or consider upgrading to fiber if available in your area.
Key Points
- The 2.4GHz vs 5GHz trap2.4GHz travels further through walls but is crowded by Bluetooth devices, microwaves, and every neighboring router in an apartment block in cities like Manila or Mumbai; 5GHz is faster but drops off quickly through concrete floors common in European housing.
- Router age matters more than people thinkA router older than 4-5 years likely lacks Wi-Fi 6 or even solid 802.11ac support, and won't handle the 300-500 Mbps plans now standard from providers like Vodafone, Telstra, and Bell.
- DNS server swaps are a free speed leverSwitching from your ISP's default DNS to Cloudflare's 1.1.1.1 or Google's 8.8.8.8 can shave hundreds of milliseconds off page load times, especially on networks run by smaller regional ISPs in Southeast Asia or Eastern Europe.
- VPNs quietly cut throughputEncryption overhead and server distance mean a VPN can reduce measured speed by 20-50 percent; if you're troubleshooting a slow result, disconnect the VPN before you test again.
- Modem-router combos from ISPs are often the weak linkThe all-in-one gateway that comes free from providers like Comcast, BT, or Jio is built for compatibility, not performance; pairing your own modem with a dedicated router frequently resolves persistent bottlenecks.
- Powerline adapters are a hidden variableThey're convenient for extending a wired connection through old wiring, but electrical noise from appliances can cut their real throughput to a fraction of the advertised rating, especially in older housing stock in the UK or Germany.
The pattern that separates a five-minute fix from a wasted afternoon is this: local hardware problems (bad placement, old firmware, channel congestion) show up as a gap between wired and wireless speeds, while ISP-side problems show up even on a direct Ethernet connection and often worsen predictably during evening peak hours.
Test both scenarios with Internet Speed Test, save the timestamped results, and you'll know within minutes whether you need to move your router six feet, or pick up the phone and hold your provider to the plan you're paying for.
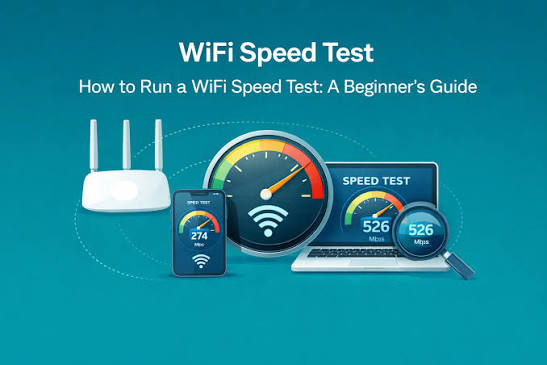
Wi-Fi vs Ethernet: Why Your Wireless Speed Test Result Differs From Your Plan
Run a wired test on a Deutsche Telekom, Comcast, or Jio Fiber connection and you will typically see a number close to what you are paying for.
Switch to Wi-Fi on the same line and the result often drops by 20 to 60 percent, sometimes more. This is not a fault in the speed test itself, it is physics. Wi-Fi standards have evolved rapidly: 802.
11n (Wi-Fi 4) tops out around 600 Mbps in ideal conditions, 802. 11ac (Wi-Fi 5) pushes past 1 Gbps on 5GHz, 802. 11ax (Wi-Fi 6/6E) adds OFDMA and the relatively open 6GHz band, and 802. 11be (Wi-Fi 7) introduces multi-link operation for even higher throughput.
But each standard's theoretical ceiling assumes a clean, unobstructed, single-device environment that almost never exists in a real home or office.
The 2. 4GHz, 5GHz, and 6GHz bands each trade range for speed differently. 2. 4GHz travels further and penetrates walls better but is crowded, shared with Bluetooth and older devices, and limited to lower peak speeds.
5GHz offers more channels and higher throughput but degrades faster with distance and obstacles like concrete, brick, or metal ductwork.
6GHz, available on Wi-Fi 6E and Wi-Fi 7 devices in markets like the United States, Germany, Brazil, and South Korea, offers the cleanest spectrum and highest speeds but the shortest effective range.
This is why Internet Speed Test consistently shows wired Ethernet as the ground-truth baseline: a cable eliminates attenuation, contention, and band selection entirely, measuring the connection your ISP, whether Vodafone, Telstra, Airtel, or Rogers, actually delivers to your router.
- Band and standard mismatchAn 802.11ac router broadcasting on 2.4GHz tops out far below its 5GHz capability, and a phone that only supports Wi-Fi 5 can never reach the multi-gigabit ceiling of a Wi-Fi 6E or Wi-Fi 7 access point, no matter what plan you pay for.
- Signal attenuation through building materialsConcrete floors in a Warsaw apartment block, brick walls in a London terrace house, or plaster and lath in an older Boston home can each cut 5GHz signal strength by 50 percent or more per obstruction, since higher frequencies penetrate solids worse than 2.4GHz.
- Channel congestion and interferenceIn dense housing like Hong Kong high-rises or Seoul apartment complexes, dozens of neighboring routers competing on the same 2.4GHz channels, plus Bluetooth devices and microwave ovens, create noise that forces retransmissions and slows throughput.
- Mesh system backhaul overheadConsumer mesh kits from Google, TP-Link Deco, or Eero often use wireless backhaul that shares the same radio as client traffic, so each extra hop between the main node and a satellite unit can halve effective speed unless a dedicated wired or tri-band backhaul is used.
- Client device radio limitationsBudget smart TVs, older laptops, and IoT devices frequently ship with single-stream Wi-Fi chips capped near 150 to 300 Mbps, well under what a Deutsche Telekom, Comcast Xfinity, or Jio fiber plan actually delivers to the router.
- Distance and antenna orientationEvery doubling of distance from the access point roughly quarters received signal power under free-space path loss, and a phone lying flat versus upright can shift throughput by tens of Mbps due to antenna polarization mismatch.
- Airtime sharing among connected devicesWi-Fi is a shared medium, so a household running video calls on Zoom, a 4K Netflix stream, and a game console update simultaneously divides available airtime, meaning any single speed test reflects contention, not just raw capacity.
The practical takeaway is to test both ways before contacting your ISP about a slow connection.
Run a Internet Speed Test test over Ethernet directly into the modem or ONT first; if that number matches your plan, whether it's a 500 Mbps Orange Livebox package in France or a 1 Gbps NBN plan in Australia, then the shortfall you see on Wi-Fi is a local radio environment issue, not a provisioning problem.
From there, switching a 5GHz-capable device to that band, relocating the router away from concrete walls and microwaves, or replacing a wireless mesh backhaul with a wired one will usually close most of the gap.
Only a wired result tells you what you are actually paying for.
How to Choose and Compare Internet Service Providers Worldwide
Choosing an internet service provider is rarely as simple as picking the highest number on a billboard.
A 1Gbps fibre plan from Verizon Fios in New Jersey behaves very differently from a 1Gbps plan delivered over aging copper by a regional DSL reseller in rural Romania, even though both display the same headline speed.
Real comparison starts with separating advertised speed from realistic, sustained throughput, which is exactly what a live speed test measures rather than a marketing brochure.
Peak-time congestion, contended cable lines shared with neighbors, and last-mile technology (fibre-to-the-home versus fibre-to-the-cabinet versus fixed wireless from providers like Starlink or T-Mobile Home Internet) all cause the gap between promised and delivered performance.
Beyond raw speed, the shape of the contract matters just as much.
Markets differ enormously: Jio and Airtel in India compete aggressively on price with minimal lock-in, while incumbents like Telkom South Africa or Movistar in several Latin American countries often require 12 to 24 month commitments with early termination fees.
Data caps, latency to the servers you actually use (gaming servers in Frankfurt, video calls routed through Singapore, or streaming CDNs cached locally by Netflix's Open Connect), customer service responsiveness, and whether bundling broadband with mobile or TV actually saves money all factor into whether a plan is genuinely good value.
And because competitive intensity varies by region, from South Korea's dense multi-operator fibre market to near-monopoly conditions in parts of the Caribbean or Central Asia, the same plan name can mean very different value depending on where you live.
- Advertised speed versus real-world throughputRegulators like Ofcom in the UK and the FCC in the US publish average peak-time speed data that often runs 20 to 40 percent below the plan's advertised number, especially on cable and shared fibre-to-the-node lines from providers like Virgin Media or Spectrum.
- Contract length and exit penaltiesDeutsche Telekom and Orange typically lock customers into 12 or 24-month terms with early termination fees, while providers like Free in France or Jio in India offer no-contract or prepaid plans that suit renters and expats better.
- Data caps and fair-use throttlingFixed wireless and satellite plans from Starlink or rural DSL providers often carry soft data caps that trigger throttling after 1 to 2TB; always check the fair-use policy, not just the headline word unlimited.
- Latency to the servers you actually useA gamer connecting to Frankfurt or Singapore data centers should test ping to those regions specifically, since a provider with excellent local speed can still show 80 to 120ms if backhaul routing is inefficient, common with some Southeast Asian and African ISPs still buying transit through single upstream carriers.
- Customer service and outage responseCheck independent review aggregators and telecom regulator complaint logs, since carriers like TalkTalk or certain MVNOs historically rank far below Bell Canada or Swisscom on resolution time for outages and billing disputes.
- Bundling and hidden equipment feesRouter rental fees from providers like Comcast Xfinity or Sky can add 10 to 15 dollars monthly, while bundling broadband with mobile SIMs from Vodafone or MTN sometimes unlocks discounts of 20 percent or more, but only if you actually use every service in the bundle.
- Market structure and competitive pressureIn markets with genuine facilities-based competition, such as South Korea with KT, SK Broadband and LG Uplus, or Romania's dense municipal fibre operators, prices per megabit are dramatically lower than in regions with a near-monopoly incumbent like many parts of sub-Saharan Africa or the Caribbean.
The single most reliable way to judge an ISP is to test it, not just read about it.
Run a real-time speed test at the address you actually live at, at peak evening hours, over several days, and compare the median download, upload, ping, and jitter figures against both the plan's advertised numbers and the regulator-published averages for that operator, whether it is Telstra in Australia, Türk Telekom in Turkey, or Claro in Brazil.
Consistent jitter under 10ms and ping under 40ms to a nearby exchange point matter far more for video calls and competitive gaming than a marginally higher download figure.
Pair that data with the contract length, cap policy, and independent complaint records before signing, and you will avoid the most common trap: choosing on advertised speed alone in a market where the fine print, not the headline number, decides your actual experience.
Understanding Bufferbloat, Packet Loss and Network Quality Beyond Raw Speed
Two connections advertising the same 100 Mbps plan can feel completely different in practice, and the reason usually has nothing to do with raw throughput.
The culprit is often bufferbloat, a condition where routers, modems, and ISP equipment queue up too much data in memory before transmitting it.
When a connection is saturated, for example during a large Windows update or a Netflix 4K stream, these oversized buffers fill up and packets sit waiting their turn instead of being sent immediately.
The result is latency that can spike from a healthy 15ms to 300ms or more under load, even though the download speed test still shows full bandwidth.
This is why a video call on Zoom or a competitive match in Valorant can turn choppy the moment someone else on the network starts a large download, despite the connection technically having plenty of capacity left.
Packet loss is a related but distinct problem, and it hits real-time applications harder than almost anything else.
When packets are dropped rather than delayed, voice calls on WhatsApp or Google Meet produce audible gaps, and online games built on UDP, such as Call of Duty or Fortnite, register rubber-banding and desync even at loss rates as low as 1-2%.
Quality of Service and newer Smart Queue Management systems exist specifically to address this by prioritizing time-sensitive traffic and actively preventing queues from growing too deep in the first place.
Modern implementations like CAKE and fq_codel, found in OpenWrt-based routers and increasingly built into mesh systems from Eero and Ubiquiti, actively manage the queue rather than just labeling packets by priority, which is the key difference between old-style QoS and the low-latency behavior people now expect from a good connection.
- Router queue size is the hidden culpritMany ISP-supplied routers, including older Sky Q hubs in the UK and basic Telstra modems in Australia, use oversized buffers that fill up under load, adding seconds of delay before a single packet drops.
- Jitter breaks real-time audio before speed doesDiscord and Zoom calls stutter not because of low Mbps but because jitter, the variation in packet arrival time, forces the app to stretch its playout buffer, causing robotic voice artifacts even on a 200 Mbps fiber line.
- Packet loss compounds over distanceA 1% loss rate on a Johannesburg to Frankfurt route can become 3-4% effective loss once TCP retransmissions and congestion on transit links like those run by Telia or Cogent are factored in.
- SQM algorithms worth knowing by namefq_codel and CAKE, both available in OpenWrt firmware, actively manage queue depth instead of just prioritizing traffic, which is why they outperform older DiffServ-based QoS on cable networks like Comcast Xfinity.
- Cellular networks hide bufferbloat differentlyOn 4G and 5G networks from carriers like Jio in India or Vodafone in Germany, bufferbloat often appears only under sustained upload, such as during a livestream, because radio schedulers buffer aggressively to smooth out signal fluctuations.
- Working from home makes this visibleA household running a Zoom call and a large Steam download simultaneously on the same DOCSIS 3.0 cable connection will see the call degrade even though total throughput never approaches the plan's advertised speed.
Two households in the same building, both subscribed to 500 Mbps fiber from providers like Verizon Fios or Vodafone Portugal, can have completely different everyday experiences if one runs a modem with a deep, unmanaged buffer and the other runs a router with CAKE enabled.
The first will see video calls freeze during a firmware update download; the second will not notice the download at all.
This is why Internet Speed Test reports ping and jitter alongside download and upload on every test across all 164 supported countries, from dense fiber markets like South Korea to satellite-dependent regions like rural Mongolia, because a single Mbps number cannot tell you whether your connection will hold up during a live video call, a competitive gaming session, or a VoIP call to a client overseas.
The History and Evolution of Internet Speed: From Dial-Up to Gigabit
The internet's speed history is a story of order-of-magnitude leaps, each one reshaping what people could actually do online. In 1990, a household modem squeezed data over analog telephone lines at 2,400 to 9,600 bits per second, enough for text-based bulletin boards but nothing more.
By the mid-1990s, 56k modems from vendors like US Robotics became the standard in the United States, Canada, and much of Western Europe, letting early web pages and basic email load in a reasonable time, even as every incoming phone call knocked users offline.
Countries with strong fixed-line telephone infrastructure, such as Germany, France, and Japan, layered ISDN on top of this in the 1990s, offering digital circuits that felt instantaneous compared to analog dial-up.
The real transformation began when telecom and cable operators started competing directly for home broadband customers.
DSL, rolled out by carriers like Deutsche Telekom, BT, and Verizon starting in the late 1990s, reused existing copper phone lines to deliver always-on connections without tying up the telephone.
Cable companies answered with DOCSIS-based broadband over coaxial television lines, and by the 2000s both technologies routinely delivered 1 to 10 Mbps.
Fiber-optic deployment then reset the ceiling entirely: South Korea and Japan pushed fiber-to-the-home nationally in the 2000s, Google Fiber brought gigabit service to Kansas City in 2012, and operators across the Gulf, including Etisalat and STC, later built some of the world's fastest national fiber footprints.
Step by Step
- Dial-up modemsAround 1990-1995, household modems delivered 2,400 to 56,000 bits per second, with 56k becoming the practical ceiling for analog phone-line internet.
- ISDN digital linesFrom roughly 1988 to the late 1990s, ISDN offered 64-128 Kbps over digital circuits, popular in Germany, Japan, and France for business use.
- Early DSL broadbandAround 1998-2000, ADSL services from carriers like BT, Deutsche Telekom, and SBC launched at roughly 512 Kbps to 1.5 Mbps, ending the dial-up busy signal era.
- Cable broadband via DOCSISBy 2000-2002, DOCSIS 1.0 and 1.1 cable modems from operators like Comcast and NTL reached 1.5 to 8 Mbps downstream, often outpacing DSL.
- Early fiber-to-the-homeAround 2004-2008, Verizon FiOS in the US and KT and NTT in South Korea and Japan introduced 20-100 Mbps residential fiber connections.
- 4G LTE mobile networksFrom 2009-2012, LTE rollouts by carriers such as Verizon, NTT Docomo, and Vodafone pushed real-world mobile speeds to 15-50 Mbps.
- Gigabit fiber goes mainstreamAround 2012-2016, Google Fiber, Chattanooga's EPB, and Singapore's StarHub offered symmetrical 1 Gbps home connections at consumer prices.
- 5G commercial launchIn 2019, carriers including Verizon, EE, SK Telecom, and China Mobile launched 5G, delivering 100-300 Mbps typical speeds and multi-gigabit peaks.
- Multi-gigabit and DOCSIS 3.1/4.0By 2022-2026, providers like Comcast, Vodafone, and Ziggo offer 2-10 Gbps tiers via DOCSIS 3.1/4.0 and XGS-PON fiber, with 5G-Advanced pushing mobile speeds further.
Key Points
- ISDN's brief bridge roleIntegrated Services Digital Network offered 64-128 Kbps in the late 1980s and 1990s across Germany, France, and Japan, giving businesses a taste of always-on digital lines before DSL made speed affordable for homes.
- DOCSIS versions drove cable gainsCable broadband speed jumped with each DOCSIS standard: DOCSIS 1.0 delivered around 40 Mbps downstream in the late 1990s, while DOCSIS 3.1, used by Comcast, Vodafone, and Liberty Global today, supports multi-gigabit tiers over the same coaxial plant.
- Fiber-to-the-home leaders by countrySouth Korea, Japan, and Singapore pushed residential fiber penetration above 80 percent by the early 2010s through KT, NTT, and StarHub, years before most of Europe and North America reached similar coverage.
- Mobile generations reset expectationsEach mobile generation roughly multiplied real-world throughput tenfold: 3G networks from carriers like AT&T and NTT Docomo averaged 1-3 Mbps, 4G LTE reached 15-50 Mbps, and 5G on Verizon, Jio, and EE now regularly exceeds 200 Mbps.
- Latency improved alongside bandwidthPing times fell from 200-400 ms on dial-up modems to under 5 ms on modern fiber and 5G, a shift that matters as much as raw speed for gaming, video calls, and cloud applications.
- Rural and emerging-market gaps persistWhile Seoul and Zurich enjoy multi-gigabit fiber, parts of rural India, Sub-Saharan Africa, and Southeast Asia still rely on 3G or satellite links from providers like Starlink, illustrating why global speed testing across 164 countries reveals such wide disparities.
The story of internet speed is really a story of removing bottlenecks one layer at a time: first the copper telephone line, then the coaxial cable, then the fiber strand, and now the wireless spectrum around 5G and emerging 6G research.
Each leap did not just make downloads faster, it unlocked new categories of use, from dial-up era text and email to today's 4K streaming, cloud gaming, and real-time video collaboration.
What has not changed is the value of knowing your actual connection quality rather than the number printed on an ISP contract.
Running a real-time test on Internet Speed Test, whether on a fiber line in Stockholm, a cable connection in Toronto, or a 5G hotspot in Manila, gives a concrete, current answer grounded in the same decades-long trajectory described above.
Common Internet Speed Myths Debunked
Internet speed is one of the most misunderstood utilities people pay for every month, and misconceptions about it lead to wasted money on unnecessary router upgrades, false blame placed on VPN apps, and unfair one-star reviews aimed at ISPs that are actually delivering exactly what they promised.
Some myths come from outdated technology assumptions carried over from DSL and early cable days; others come from confusing marketing terms used by carriers in the United States, India, Nigeria, and the Philippines, where mobile data often substitutes for fixed broadband entirely.
The truth is that internet performance depends on a chain of factors, your ISP's provisioned bandwidth, your router's capabilities, the Wi-Fi spectrum in your home, the routing path to the server you're reaching, and even the time of day you're testing.
Below are the misconceptions we hear most often from users running tests on Internet Speed Test across 164 countries, each corrected with the specific mechanism behind the real answer.
- Faster Wi-Fi router means faster internetA new router improves local signal strength and range, but your download and upload ceiling is set by the plan you pay your ISP for, whether that's Xfinity, Vodafone, or Jio. A Wi-Fi 6E router on a 25 Mbps DSL line still tests at 25 Mbps.
- Speed tests are inaccurate or riggedTools like Internet Speed Test measure real data transfer to nearby servers using multiple TCP connections, the same method engineers use to diagnose network issues. Results vary run to run because of network congestion, not because the test is broken.
- 5G is always faster than home fiber5G mmWave can hit over 1 Gbps in dense areas of Seoul or Chicago, but most users get mid-band 5G averaging 100-300 Mbps, well below the 900+ Mbps that providers like Google Fiber or Chattanooga's EPB deliver over fiber-optic lines.
- A VPN always slows down your connectionA VPN adds encryption overhead and routes traffic through a remote server, so some slowdown is normal, but a well-run service using WireGuard can cost under 10 percent throughput. Badly congested or distant VPN servers, not encryption itself, cause the big drops.
- Mbps and MBps are the same thingInternet plans and speed tests report megabits per second, but file download managers and browsers often show megabytes per second. A 100 Mbps plan downloads at roughly 12.5 MBps, a common source of confusion when comparing an ISP's advertised speed to a file transfer progress bar.
- Fiber always beats cable for gaming latencyFiber from providers like Verizon Fios or Orange in France typically has lower latency and symmetric upload speeds, but well-provisioned cable networks from Comcast or Virgin Media can deliver ping times under 20ms. Distance to the game server matters more than the last-mile medium.
- Unlimited data plans have no speed limitsMany unlimited mobile plans from carriers like T-Mobile, EE, or Telkomsel include deprioritization after a data threshold, often 30-50GB, where speeds drop noticeably during network congestion. The plan is unlimited in volume, not in guaranteed speed.
The common thread across these myths is that internet speed is a chain, and people tend to blame or credit whichever link they can see, the router sitting on the shelf, the bars on a phone screen, or the label on a data plan.
The real determinants sit mostly out of view: the provisioned bandwidth from your ISP, the condition of the local loop or cell tower, the routing path to the server you are testing against, and the physical medium carrying the signal, whether that is DOCSIS cable in Toronto, GPON fiber in Seoul, or LTE spectrum in rural Kenya.
Running a real-time test on Internet Speed Test across download, upload, ping, and jitter, and comparing it against what your ISP actually promised in the contract, is the fastest way to replace assumptions with evidence, whether you are troubleshooting a slow Zoom call in Berlin or deciding if it's finally time to upgrade from cable to fiber.
The Future of Internet Speed: What Comes Next
The internet's next decade will be defined less by dramatic leaps and more by steady convergence, fixed and mobile networks closing the gap, urban and rural areas narrowing their divide, and download and upload speeds finally reaching parity. Fiber remains the backbone of this shift.
Countries like Spain, South Korea, and the United Arab Emirates already report fiber penetration above 80 percent, and nations earlier in the buildout curve, including Nigeria, Indonesia, and the Philippines, are laying tens of thousands of kilometers of new fiber annually through operators such as MTN, Telkomsel, and PLDT.
As that infrastructure matures, the baseline expectation for "fast enough" keeps rising.
At the same time, wireless technology is catching up to wired performance. 5G-Advanced networks from carriers like Jio in India, Deutsche Telekom in Germany, and AT&T in the US are delivering multi-hundred-megabit speeds with latency low enough for cloud gaming and real-time collaboration.
Meanwhile, low-earth-orbit satellite constellations are solving a problem fiber and cellular towers never could economically: dependable broadband for people in the Sahel, the Andes, or Pacific island nations like Fiji and Vanuatu.
Together these threads point toward a future where a stable, high-speed connection is no longer a matter of geography but simply the default.
- Fiber-to-the-home keeps expandingFrance's ouverture of FTTH lines, India's BharatNet rural rollout, and Brazil's aggressive fiber growth under operators like Vivo and Claro are pushing gigabit access far beyond capital cities into secondary towns and villages.
- 5G-Advanced (3GPP Release 18) goes liveCarriers such as SK Telecom in South Korea, China Mobile, and Verizon are trialing 5G-Advanced features like AI-driven network slicing and uplink boosts, narrowing the latency gap between mobile and fixed-line connections.
- 6G research acceleratesNokia Bell Labs, Samsung, and Japan's NTT Docomo are running early 6G testbeds targeting terahertz spectrum and sub-millisecond latency, with commercial standards expected around 2030.
- LEO satellite constellations reach the unconnectedStarlink, OneWeb, and Amazon's Project Kuiper are delivering 100-200 Mbps to rural Mongolia, remote Alaska, and the Amazon basin, places where laying fiber or towers was never economical.
- Symmetric multi-gigabit plans go mainstreamSingapore's StarHub, South Korea's KT, and US providers like Google Fiber and Ziply now sell symmetric 2, 5, even 10 Gbps residential plans, reflecting how upload-heavy use (cloud backup, streaming, remote work) has caught up with download demand.
- Wi-Fi 7 and multi-gig home networking close the last meterRouters supporting Wi-Fi 7's 320 MHz channels and multi-link operation, from TP-Link, Asus, and Netgear, mean the bottleneck is shifting from the ISP connection to home network hardware.
- Edge computing reshapes what speed meansCloudflare, Akamai, and AWS are pushing compute closer to users, so effective performance depends as much on round-trip latency to a nearby edge node as on raw bandwidth.
None of this changes what actually matters for someone deciding whether their connection is doing its job.
A household in Nairobi on Safaricom fiber, a remote worker in rural Saskatchewan on Starlink, and an office in Seoul on KT's 10-gigabit plan all need the same basic answer: is this connection delivering what I am paying for right now.
That is precisely why real-time measurement matters more, not less, as networks diversify across fiber, 5G-Advanced, and satellite.
Internet Speed Test tests download, upload, ping, and jitter live across 164 countries, so as multi-gigabit symmetric plans, LEO satellite links, and next-generation mobile networks reshape what "fast" means, you can verify your actual speed in seconds, with no signup and no app, wherever in the world you happen to be.
Frequently Asked Questions
What exactly does a speed test measure?
It measures three things: download speed (Mbps data pulled from a server to your device), upload speed (Mbps sent from your device), and latency or ping (milliseconds for a data packet to round-trip). Internet Speed Test also measures jitter, the variation in ping over time, which matters for calls and gaming.
What is a good download speed for everyday use?
25 Mbps handles HD streaming and browsing for one person. A household of four streaming 4K on multiple devices, gaming, and working from home comfortably needs 100-300 Mbps. Fiber connections in South Korea, Singapore, and the UAE routinely exceed 300 Mbps; rural areas in many countries still average under 25 Mbps.
What upload speed do I actually need?
5-10 Mbps covers video calls and cloud backups. Streamers on Twitch or YouTube, and remote workers uploading large files or syncing to services like Dropbox, should aim for 20+ Mbps. Cable and DSL connections (common with Comcast, Vodafone DSL, BSNL) often have much lower upload than download, unlike symmetric fiber.
What is ping and why does it matter?
Ping is the round-trip time in milliseconds between your device and a server. Under 20ms is excellent for competitive gaming, 20-50ms is good, and above 100ms causes noticeable lag in first-person shooters and video calls. Physical distance to the server matters: a player in Brazil pinging a US East server will see higher latency than one in Chicago.
What is jitter and why should I care about it?
Jitter is the variation in ping between packets, measured in milliseconds. High jitter makes calls choppy and voice-over-IP unreliable even if average ping looks fine. Under 5ms jitter is ideal for VoIP tools like Zoom or WhatsApp calls; above 30ms causes audio dropouts and garbled video regardless of raw bandwidth.
Why do my speed test results vary between runs?
Network conditions change constantly: other devices on your Wi-Fi, ISP network congestion at peak hours (typically 7-11pm), server load, and route changes all affect results. Run tests at different times of day and to multiple server locations to get a representative picture rather than relying on one single result.
Why is my Wi-Fi speed slower than my Ethernet speed?
Wi-Fi shares bandwidth with interference from neighboring routers, microwaves, and thick walls, and older standards like Wi-Fi 4 (802.11n) cap out far below your plan's speed. A wired Ethernet connection avoids this entirely. If your plan is 500 Mbps or higher, only Ethernet or Wi-Fi 6/6E will realistically deliver it.
How can I improve slow Wi-Fi speeds at home?
Move the router to a central, elevated, open location away from walls and appliances. Switch to the 5GHz band for speed over shorter range, update router firmware, and reduce connected devices during heavy use. Mesh systems from Eero, TP-Link Deco, or Google Nest Wifi help in larger homes with dead zones.
Why is my internet slow even though I pay for a fast plan?
Common causes: outdated router hardware, too many connected devices, background downloads or cloud backups, ISP throttling during peak hours, a failing modem, or the test server being congested. Restart your router, run a wired test, and try multiple test servers to isolate whether it's your network or the ISP.
How does mobile data speed compare to home broadband?
5G networks in South Korea, the US, and the UAE can exceed 300-500 Mbps under ideal conditions, rivaling fiber, but real-world speeds drop sharply with distance from towers and network congestion. 4G LTE typically delivers 15-50 Mbps. Fixed broadband is generally more stable since it isn't shared with as many nearby users.
Why does my country show slower average speeds than others?
Speeds depend on infrastructure investment, population density, and geography. Countries like Singapore, South Korea, and the UAE lead with dense fiber rollout. Large countries with dispersed rural populations, such as Canada, Brazil, or Australia, show wider gaps between urban fiber areas and remote regions still on DSL or satellite.
How do I compare my ISP against others in my country?
Run tests at consistent times over several days and compare your results against published national averages, which vary widely: fiber-heavy markets like Romania and Japan post high medians, while regions still transitioning from copper, like parts of South Africa or the Philippines, average lower. Internet Speed Test detects your ISP automatically so you can track results by provider over time.
What speed do I need for video streaming on Netflix, YouTube, or Disney+?
Standard definition needs about 3 Mbps, HD needs 5-10 Mbps, and 4K Ultra HD needs 25 Mbps per stream. If several people in your household stream simultaneously, multiply accordingly, and add headroom since real-world speeds rarely hit your plan's advertised maximum.
What internet speed is needed for online gaming?
Bandwidth needs are modest, 3-6 Mbps download and 1-3 Mbps upload, but ping and jitter matter far more. Competitive titles like Valorant, Counter-Strike, or Call of Duty need ping under 30-50ms and low jitter; console cloud gaming services like Xbox Cloud Gaming or GeForce Now need at least 20 Mbps stable download.
What speed do I need for remote work and video calls?
For smooth Zoom, Microsoft Teams, or Google Meet calls, 3-4 Mbps up and down per participant is the baseline, but 25 Mbps download and 5-10 Mbps upload gives comfortable headroom for screen sharing, cloud syncing, and multiple calls at once in a household.
Does using a VPN slow down my internet speed?
Yes, typically. Encryption overhead and routing through a remote VPN server, especially one in another country, adds latency and can cut throughput by 10-30% or more. Choosing a VPN server geographically close to you and using modern protocols like WireGuard minimizes the loss compared to older OpenVPN setups.
Should I test my speed with a VPN on or off?
Test with the VPN off first to see your true ISP connection speed, then test with it on if you want to know real-world performance while using the VPN. Comparing both tells you exactly how much overhead the VPN and its server distance are costing you.
What is bufferbloat and why does it hurt video calls and gaming?
Bufferbloat happens when routers or modems buffer too much data during heavy uploads or downloads, spiking latency even though raw speed looks normal. It causes video calls to lag and games to stutter whenever someone else on the network starts a large download. Routers with modern queue management (like those supporting SQM or CAKE) reduce it.
How do I fix bufferbloat on my home network?
Enable Smart Queue Management (SQM) or Quality of Service (QoS) settings in your router if supported, upgrade to a router with active queue management, or reduce simultaneous heavy uploads and downloads during calls or games. This keeps latency low even when the connection is fully loaded.
Is fiber always faster than cable or DSL internet?
Fiber offers the highest realistic ceiling, symmetric upload and download, and lower latency, delivered by providers like Verizon Fios, Google Fiber, and Jio Fiber. Cable, from providers like Comcast Xfinity or Virgin Media, can match fiber download speeds but usually has much weaker upload. DSL and copper-based lines lag both, especially at distance from the exchange.
What is satellite internet speed like compared to fiber or cable?
Modern low-earth-orbit satellite services like Starlink typically deliver 50-200 Mbps download with 25-60ms latency, far better than older geostationary satellite internet which had 500ms+ latency. Still, both trail fiber and cable in consistency, especially during weather interference or high local user density.
How accurate is an online speed test compared to my real internet performance?
A speed test measures a snapshot to a specific server at a specific moment, giving a close approximation of your connection's capability. Real-world app performance also depends on the destination server's location and load, so a fast speed test result doesn't guarantee equally fast performance on every website or service.
Why do speed test results differ between different testing tools?
Different tools use different test servers, file sizes, connection counts, and measurement windows. A test using multiple parallel connections can report higher speeds than one using a single connection. Testing to a nearby server generally gives more accurate real-world results than one on another continent.
Does Internet Speed Test require signup or an app download?
No. Internet Speed Test runs entirely in your browser with no account, no email, and no app install. Open the page and the test starts immediately, making it usable on any device, anywhere among the 164 countries it covers, without friction or data collection barriers.
How does Internet Speed Test detect my ISP and location?
It uses your public IP address to identify your internet service provider and approximate location automatically, then displays this alongside your results so you can track performance by provider and region over time without manually entering any information.
What makes the animated real-time charts useful during a test?
Instead of showing only a final number, the animated charts plot download, upload, and ping as they happen, revealing spikes, drops, and instability in real time. This makes problems like bufferbloat or inconsistent Wi-Fi visible during the test itself, not just as a single averaged result afterward.
Why does Internet Speed Test cover 164 countries specifically?
Broad server coverage means the test can measure your connection against a nearby location almost anywhere in the world, from major hubs like the US, Germany, and Japan to less-served regions across Africa, Central Asia, and the Pacific, giving more representative results than tools reliant on a handful of server regions.
Can I use Internet Speed Test on my phone as well as my computer?
Yes. It works in any modern mobile or desktop browser on iOS, Android, Windows, macOS, or Linux, with no app to install. This makes it easy to compare Wi-Fi versus mobile data speed directly on the same device in seconds.
How often should I run a speed test to monitor my connection?
Test at different times of day, especially peak evening hours, over at least a week if you suspect an ongoing problem. A single test only shows one moment; a pattern of repeated low results at the same time each day is stronger evidence for a genuine ISP or network issue worth reporting.
Speed Test Interest Worldwide
The 10 countries with the highest monthly search volume for speed-test-related terms, real demand data, not a speed benchmark.
Monthly search volume for speed-test-related terms, by country (real search-demand data used to build this site, not a speed benchmark).
Broadband Technology Comparison
A quick reference for how the major connection types compare on typical speed and latency.
| Technology | Typical Download | Typical Upload | Typical Ping | Where It's Common |
|---|---|---|---|---|
| Fiber (FTTH) | 100 – 2,000+ Mbps | 100 – 2,000+ Mbps (often symmetric) | < 10 ms | Urban areas worldwide; South Korea, Japan, Singapore, UAE, Nordic countries lead adoption |
| Cable (DOCSIS) | 50 – 1,000 Mbps | 5 – 50 Mbps | 10 – 30 ms | US, Canada, parts of Europe and Latin America |
| DSL / VDSL | 5 – 100 Mbps | 1 – 20 Mbps | 15 – 40 ms | Widely available legacy option, especially rural areas |
| Fixed Wireless | 25 – 300 Mbps | 5 – 50 Mbps | 10 – 30 ms | Suburban/rural areas without cable or fiber |
| Satellite (LEO) | 25 – 220 Mbps | 5 – 25 Mbps | 25 – 60 ms | Remote and rural regions worldwide (e.g. Starlink, OneWeb) |
| Mobile 5G | 50 – 500+ Mbps | 10 – 50 Mbps | 10 – 30 ms | Expanding rapidly across urban centers globally |
| Mobile 4G/LTE | 10 – 50 Mbps | 5 – 15 Mbps | 30 – 60 ms | Still the primary mobile connection in much of the world |
Approximate real-world ranges by technology category; actual speeds vary by provider, plan tier, and local infrastructure.
Did You Know?
- Mbps vs MB/sA 100 Mbps connection downloads at about 12.5 MB per second, not 100 MB, since there are 8 bits in a byte.
- Fiber vs light speedData in a fiber-optic cable travels at roughly two-thirds the speed of light in a vacuum, still fast enough that distance, not the cable itself, is usually the real latency bottleneck.
- Jitter matters more than you thinkA stable 40 ms connection often feels smoother on a video call than an unstable connection averaging 20 ms, because consistency matters more than raw speed for real-time apps.
- Wi-Fi loses speed to distanceEvery wall and every meter between your device and your router can measurably reduce your real-world Wi-Fi throughput compared to a wired connection.
- Asymmetric by designMost home broadband plans intentionally offer far more download than upload bandwidth, because typical household usage (streaming, browsing) is overwhelmingly download-heavy.
- Satellite has come a long wayModern low-earth-orbit satellite internet is dramatically faster and lower-latency than older geostationary satellite services, making it viable for video calls for the first time.
- Peak-hour slowdowns are realMany users see measurably slower speeds in the evening simply because more people in the same area are online at once, competing for the same local infrastructure.
- Bufferbloat is often invisibleA connection can have excellent download speed and still feel laggy under load, a symptom of bufferbloat rather than insufficient bandwidth.
Guides
How Does an Internet Speed Test Actually Work?
A speed test measures ping by timing small round-trip requests, then measures download and upload…
How to Fix a Slow Internet Connection: A Step-by-Step Guide
Most slow connections are fixed by restarting your router, moving closer to it or switching to…
Mbps Explained: What Internet Speed Numbers Actually Mean
Mbps (megabits per second) measures how much data your connection can transfer per second; higher…
Ping, Jitter, and Latency Explained: Why They Matter for Gaming and Calls
Ping (latency) is the round-trip delay for data to reach a server and return, measured in…
Why Internet Speed Test
Internet Speed Test is a free, real, browser-based internet speed test covering 164 countries, each with its own dedicated page built from real search-demand data. Unlike a single generic tool, every country page pairs the same accurate measurement engine live download, upload, ping, and jitter readings shown on animated gauges and a real-time latency chart with content and FAQs written specifically around how people in that country search for and think about their connection speed.
There's nothing to install and nothing to sign up for: click Start Speed Test above and get a full reading in under a minute, with your last 20 results saved locally in your browser so you can track your connection over time, compare Wi-Fi against ethernet, or hold your ISP accountable to the plan you're paying for. Explore our guides to understand what your results mean, or browse the full list of 164 countries to find your market's dedicated page, from major markets like the United States, India, and Brazil down to smaller markets with their own local search context and typical broadband benchmarks.
Because every page shares the same underlying measurement engine, a result on this homepage is directly comparable to a result on any of our country pages useful if you travel, use a VPN, or simply want to check how your connection compares to your own country's typical benchmark. Browse the country directory to find yours.